Let your collector collect, not compute
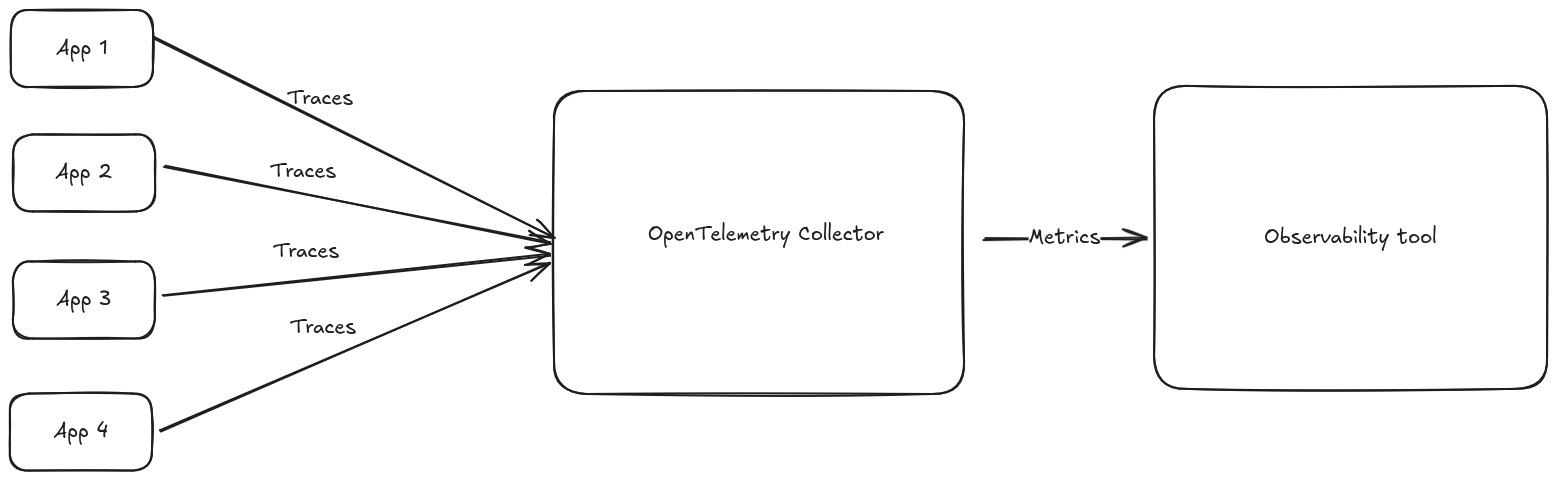
observabilityThe OpenTelemetry collector is a software whose main responsibility is to act as a centralised receiving point for all your observability signals like Metrics, Logs and Traces, and forward these signals to your observability tooling of choice. In additon to that, the OpenTelemetry collector can filter and transform the incoming data: more importantly for today’s discussion, it can compute new data from the incoming one. There is a growing trend to compute metrics from traces, with connectors like the spanmetricsconnector or the servicegraphconnector. The fact that the distributed tracing scene is far more standardised around the OpenTelemetry standard compared to the metrics one makes this an appealing idea to also be able to produce a set of standardised metrics, in a language agnostic fashion: that’s exactly how solutions like Grafana Labs Application Observability try to achieve this promise of language agnostic observability solution. While I’m onboard with the idea, I am not convinced that it should be the OpenTelemetry collector responsability to compute these aggregation metrics from the traces.
It all works until it doesn’t
When we’re dealing with little enough data, one instance of the OpenTelemetry collector might be enough to handle the load. In this case, the calculation of metrics from traces will work flawlessy because the instance has all the data at its disposal.
But sooner or later your volumes will grow to a point where it’s not feasible to handle all the load with one instance: usually you’ll end up load balancing the traces across different Collector instances, in an architecture similar to this one
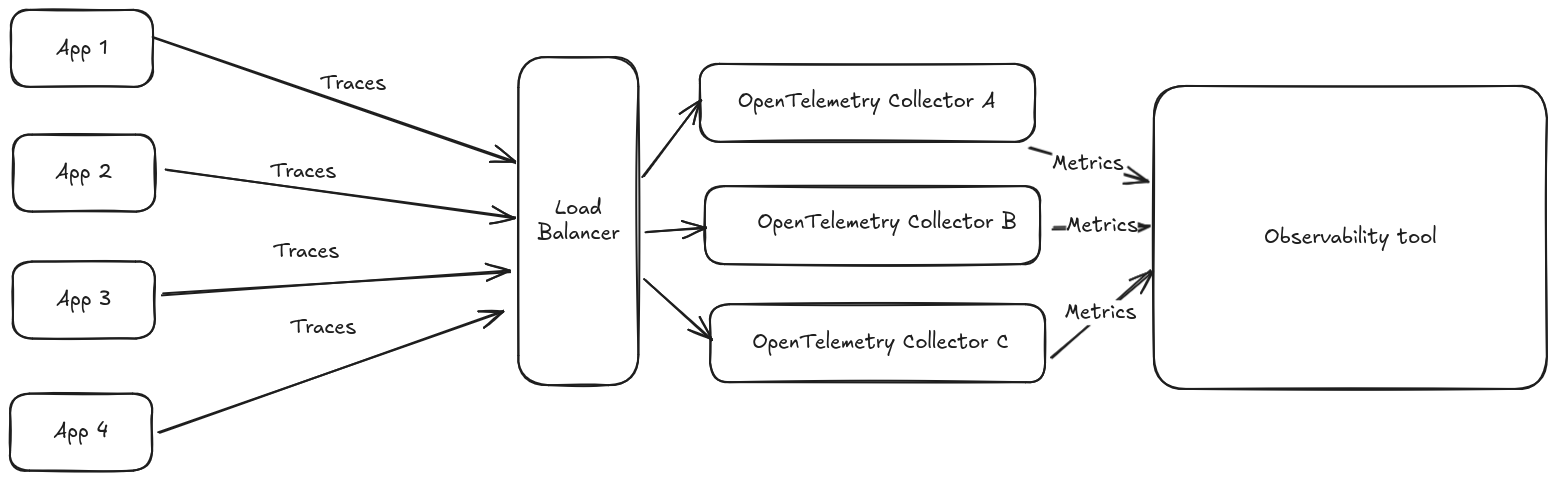
Common load balancing strategies for this scenario will route the trace to a given instance based on the traceId: for accurate tail sampling, the instance making a decision to drop or keep a given trace should receive all the spans for the given trace. However, this load balancing strategy is counter productive to compute RED metrics. The problem is that different OpenTelemetry Collector instances will end up receiving spans originating from the same service, and end up generating potentially conflicting metrics that your observability tool of choice might not be able to handle correctly, or might cost you more money to ingest. Let’s try to give an oversimplified example: say your service app1 receives 2 external calls, responding to the first one in 500ms and to the second one in 700ms. This will generate two spans which are load balanced between 2 OpenTelemetry collector instances: each instance will generate the same metric with the same dimension set but different values, violating the Single writer principle.
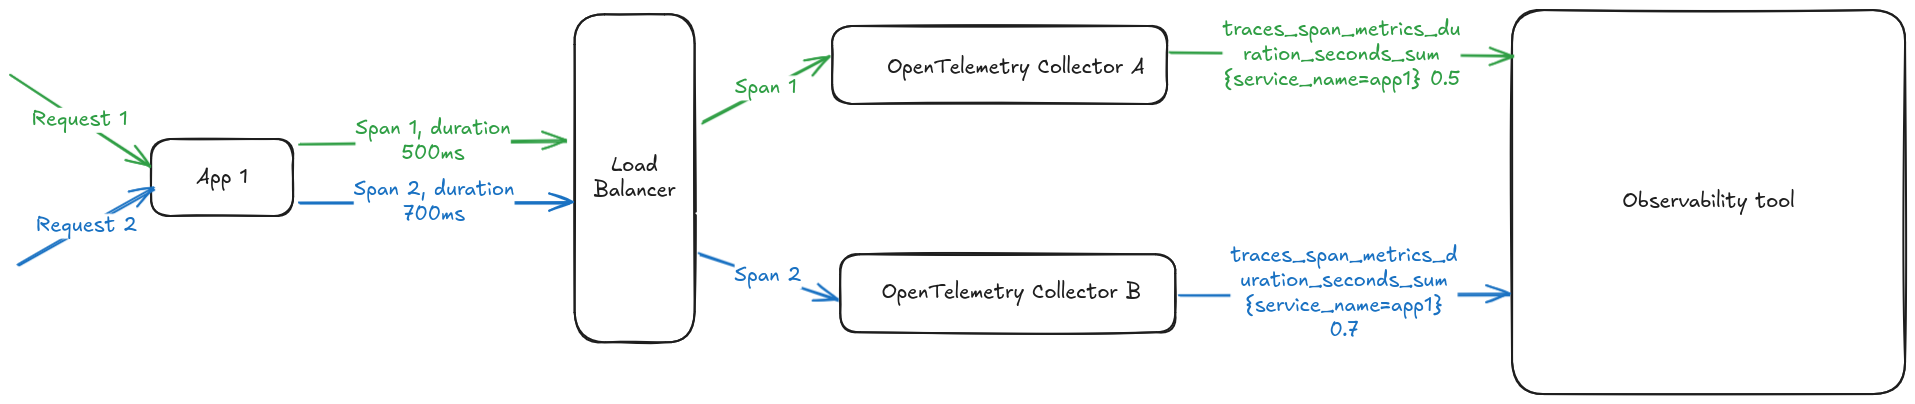
This is a known and acknolewedge limitation of the spanmetric processor, for which the recommended workaround for the setup shown in the example would be to add a dimension with an identifier of the OpenTelemetry collector instance generating the metrics. That solves the issue, but now 2 different timeseries are generated instead of one, and this 2 factor is linearly dependent on the number of collector instances you’re running. This will likely have an effect on your observability bill.
But what if we offload these computations from the collector altoghether?
Apache Flink as a spanmetric replacement
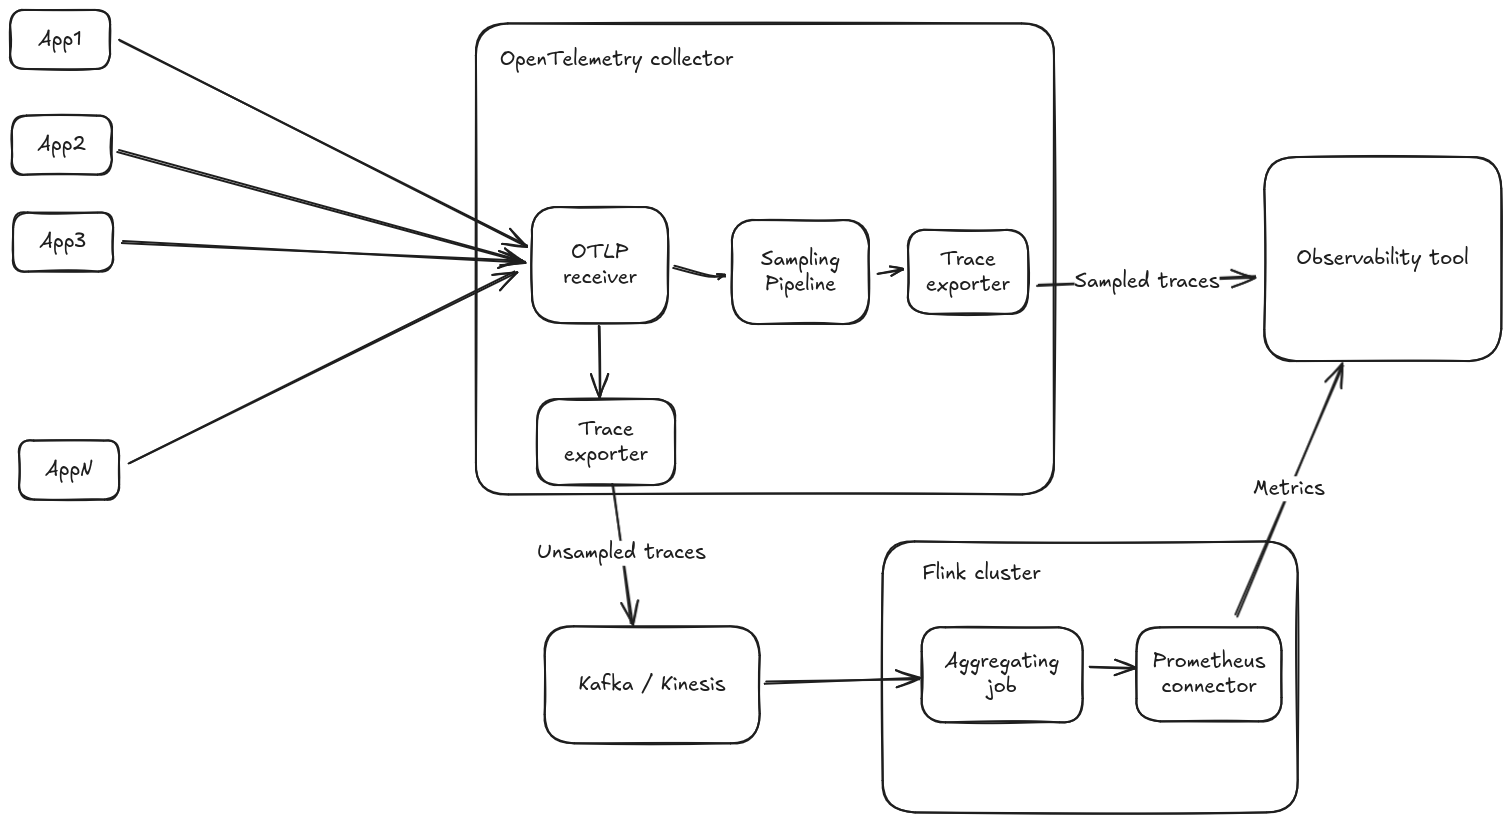
Flink is a well knwon real time analytics tool. In December 2024, the Flink prometheus connector was announced: this connector can be used to remote write metrics resulting from event aggregation in Prometheus format, we could send the traces from the collector to Flink, and do the aggregation in Flink! The architecture zoomed in a single collector instance would look something like this, splitting out completely the sampling pipeline from the aggregation pipeline:
And zooming a bit out to multiple collector instances
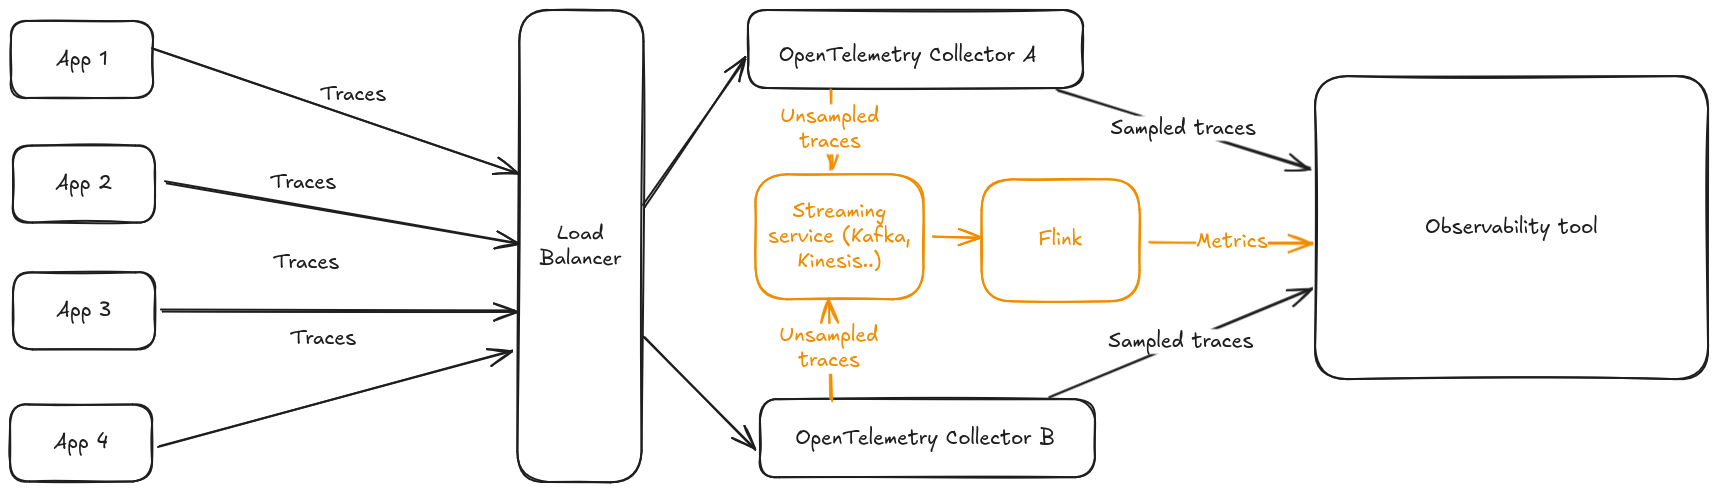
I built a POC validating this approach that can be found in this GitHub repo. This approach has the following advantages:
- Flink natively operates in a cluster mode, and the traces can be sharded internally to Flink in a different way than the load balancing done for the collector, since we care about respecting the Single Writer principle and not about sampling.
- Frees up computing resources from the collector that can do what it does best, collect and forward observabilty signals.